Building a Bare-Metal Kubernetes Homelab — Part 1: From a Cluster to a Platform
Part 0 ended with one Talos control-plane node, netbooted end-to-end from a PXE server on my NAS, and a promise of a tidy series: a rebuild-loop demo, then GitOps, then observability, then HA.
I didn’t write that series. Instead, over about a day and a half, I took the cluster from “one node that works” to the platform that runs my entire home lab — every download client, the whole media-automation stack, a metrics-and-logs pipeline, and a single dashboard fronting all of it. Twenty-one HelmReleases, all green, GitOps-managed, reachable on the LAN and over the tailnet.
This is Part 1: the jump from a cluster to a platform. As before, the clean architecture is the short half of the post. The honest catalogue of how it bit me is the useful half — and this phase had a genuinely subtle one, the kind where ping succeeds and curl hangs and you question your career.
The repo is public: github.com/josephsindel/home_stack. The commit history is the real build log, and it timestamps the whole migration to a single sprint.
The shape of the platform
The Part 0 plan named two reconcilers (Flux for infrastructure, Argo CD for apps). I cut that to one. Two reconcilers means a standing argument about who owns a given resource; for a one-person lab, Flux owning everything is less to reason about and one fewer way to get a fight over a field. The repo’s kubernetes/ tree is a layered set of Flux Kustomizations:
kubernetes/
  flux/                 # the flux-operator FluxInstance (Flux v2.8.x)
  cluster/
    controllers/        # Cilium LB, cert-manager, csi-driver-nfs, local-path
    config/             # cluster-wide config, namespaces, secrets wiring
    apps/               # the actual workloads
The ordering is a hard dependency chain — controllers reconcile before config before apps — so a workload can never come up before the storage class and load-balancer it needs exist. Everything is declarative, everything is in Git, and the secrets are SOPS-encrypted with an age key (the persistent-secrets-bundle discipline I learned the hard way in Part 0, peril #2). The cluster is now two MS-01 nodes — a control plane and a worker, both amd64 with Intel iGPUs.
Putting Kubernetes services on a flat LAN
Here’s the first genuinely interesting problem, and it’s one you never face in a cloud. In EKS, a Service of type: LoadBalancer calls a cloud API and a load balancer appears. On a flat home LAN behind a UniFi gateway, there is no such API. The cluster has to hand out and announce LAN IPs itself.
Cilium does both. LB-IPAM allocates IPs from a pool; L2 announcements make the cluster answer ARP for those IPs so the rest of the house can reach them:
apiVersion: cilium.io/v2alpha1
kind: CiliumLoadBalancerIPPool
metadata: { name: home-lan-pool }
spec:
  blocks:
    - start: "192.168.86.235"
      stop:  "192.168.86.254"
The catch is that this pool lives on the same subnet my UniFi gateway hands out DHCP leases from. If both the cluster and the router think they own 192.168.86.240, you get an IP conflict that’s maddening to debug. So before allocating a single service IP I shrank the UniFi DHCP range to .6–.234 and carved .235–.254 out for the cluster — done over the UniFi controller’s REST API, because of course the network is also config-as-code at this point. Cluster IPs and DHCP leases now live in disjoint halves of the subnet, by construction.
Two Cilium traps on the way to a working datapath, both transferable:
The stale CiliumNode InternalIP black-hole. During the build I migrated the nodes from one /24 to another. The worker’s CiliumNode object cached its first-boot DHCP address as its InternalIP. Cross-node traffic uses that InternalIP for the VXLAN tunnel — so every packet between the two nodes was being sent to an address that no longer existed. Pods on one node simply couldn’t reach pods on the other; nothing logged an error, the traffic just vanished. Fix: restart the affected node’s cilium-agent so it re-derives its IP. (Same lesson, different layer, as Part 0’s interface-name deadlock: a stale cached address is a silent killer.)
The server-side-apply ownership fight. Helm v4 uses server-side apply. The cilium-operator Deployment had a .spec.replicas field that kubectl owned from an earlier manual scale, and SSA refused to let Helm touch a field another manager claimed. Fix: kubectl delete deploy cilium-operator, then let Helm recreate it cleanly — safe, because the operator isn’t in the datapath. Field-ownership conflicts are the tax you pay for SSA’s correctness, and the fix is almost always “stop claiming the field.”
Exposing to the tailnet: the trap that ate an evening
I want some of these services reachable from my phone anywhere, which means the tailnet, which means the Tailscale Kubernetes operator. Installing it is easy. Using it correctly cost me an evening and produced the single most subtle lesson of this whole phase.
The operator advertises two ways to expose a service. The obvious one is an annotation — tailscale.com/expose — that puts an L4 proxy in front of a Service. I used it. The tailnet showed the device, tailscale ping succeeded, and every real TCP connection timed out anyway. That gap — control plane says yes, data plane says nothing — is the entire bug, and it took me way too long to see why.
The L4 expose annotation DNATs the incoming tailnet packet straight to the Service’s ClusterIP. But there’s no kube-proxy on this cluster — Cilium does ClusterIP translation in eBPF at the socket layer, the moment a process actually calls connect(). A packet that shows up already pointed at a ClusterIP never makes that connect() call, so nothing ever translates it; it’s addressed to a virtual IP that routes nowhere, and it gets dropped on the floor. And tailscale ping? That’s a control-plane probe — it never goes near the ClusterIP path, so it happily reports a healthy peer the whole time real traffic is dying.
The fix is to use a Tailscale Ingress instead of the L4 expose:
apiVersion: networking.k8s.io/v1
kind: Ingress
spec:
  ingressClassName: tailscale
  tls:
    - hosts: ["homepage"]
  rules:
    - http:
        paths:
          - { path: /, pathType: Prefix, backend: { service: { name: homepage, port: { number: 3000 } } } }
With an Ingress, tailscaled itself dials the backend Service from inside the cluster — a real local connect(), which Cilium’s socket-LB does translate — and serves the result at https://<name>.<tailnet>.ts.net with a real MagicDNS certificate. Backend reachability works because the connection originates the way Cilium expects.
This is now my rule for every tailnet-exposed service on the cluster: Ingress, never the L4 expose annotation. The annotation isn’t broken in general; it’s incompatible with kube-proxy-replacement specifically, and that incompatibility manifests as the most deceptive symptom in networking — the control plane says yes while the data plane says nothing at all.
(Getting the operator running at all has its own prerequisites worth noting: its OAuth client needs the tag:k8s-operator tag and Devices + Auth-Keys write scopes, the tailnet ACL policy has to declare tagOwners for the tags it manages, and the tailscale namespace has to be PodSecurity privileged because the proxy pods run a privileged sysctl init container. None of these fail gracefully.)
Auth and remote access are the part of all this I most want to come back to. Tailscale Ingress works and it’s what I’m running, but the whole identity-and-access story — who can reach what, how it’s authenticated, what’s exposed where — deserves a deliberate pass rather than the per-service decisions I’ve been making as I go. For this phase I got it working and kept pushing forward; tightening it up is its own project.
Storage: two classes, and the one that eats your library
Stateful workloads forced an early decision, and getting it wrong corrupts data, so it’s worth being explicit.
This is the part of bare metal that punched me hardest, and I should be honest about why. I’ve spent the last several years in the cloud, where storage is an API call: you ask for an EBS volume or an EFS share and durability, replication, snapshots, and performance tiers are someone else’s problem — you pick gp3 or io2, set a retention policy, and stop thinking about it. I hadn’t actually run a datacenter in years, and I’d forgotten how much that abstraction was quietly carrying. On bare metal it all lands back on me: is this disk local or over the network, what are its fsync semantics, which numeric uid owns the files, and what happens to the data if this one NVMe dies. There is no magic durable volume. There’s a disk in a box, and a NAS I also own.
That reckoning is what produced the rule. The cluster runs two storage classes:
local-path(node-local disk) — the default, and mandatory for every database. I learned this the documented way: NFS corrupts MySQL/MariaDB/Redis. Their write patterns (fsync semantics, AOF rewrites, lock files) assume a local POSIX filesystem; over NFS they silently corrupt. Databases get node-local storage, full stop.nfs-synology(NFS to the NAS) — bulk media only. The terabytes of library content that the media stack reads and writes, where NFS is exactly right.
Two Talos-specific traps under that:
local-path needs a kubelet mount on an immutable OS. Talos’s filesystem is read-only by design, so the local-path provisioner can’t just write under /var. Each node’s machine config needs an extraMount binding /var/local-path-provisioner, or every PVC fails with “read-only file system.” It’s one stanza in the Talos patch, and it’s invisible until a database pod won’t start.
Never set fsGroup on the big NFS volume. This one I’ll never repeat. When a pod mounts a volume with a fsGroup set, the kubelet recursively chowns the entire volume to that group on mount. Point that at an NFS share holding a media library of tens of thousands of files and the pod hangs forever while the kubelet walks the tree over the network. The linuxserver *arr images don’t need it — they take PUID/PGID env vars — and for the others I set runAsUser/runAsGroup to the NAS’s numeric IDs (NFS authorizes by uid/gid number, not name) and leave fsGroup unset. One innocent-looking field, one hung pod, one library you’re afraid you just rewrote.
And to be clear, what I have now is the make-it-work version, not the make-it-right version. Node-local local-path means a database’s data lives on exactly one node’s disk — lose that node and I’m restoring from backup, not failing over. The cloud handed me replicated, snapshotted block storage for free and I stopped noticing; here I have to build that property back on purpose. Reimplementing this properly is one of the bigger items on the list: replicated storage so a node can die without data loss, real snapshots, and a faster local tier for the databases. For now it’s DBs on local disk, media on NFS, and a backup job — enough to run on, not enough to relax about.
Migrating real workloads without reconfiguring them
The platform isn’t the point; the workloads are. The big migration was the media-automation stack — Sonarr, Radarr, Prowlarr, Bazarr, SABnzbd, and qBittorrent — off Docker on the mediaserver and onto the cluster. The constraint I set: migrate without reconfiguring the services’ view of each other. These apps reference each other by URL (Prowlarr pushes to the *arr; the *arr send downloads to SAB and qBittorrent); if those URLs broke, I’d be re-pairing a dozen integrations by hand.
So I preserved the contract. Each app kept its migrated UrlBase (/sonarr, /radarr, …) and its real port (8989 / 7878 / 9696 / …), exposed on a stable LB IP, with the existing library bind-mounted from NFS at the same /mnt/nas/content path the mediaserver used (via a subPath). Config (144 series, 2,933 movies, 266 indexers) lifted into local-path PVCs. The inter-service URLs resolved unchanged on the other side — the apps didn’t know they’d moved.
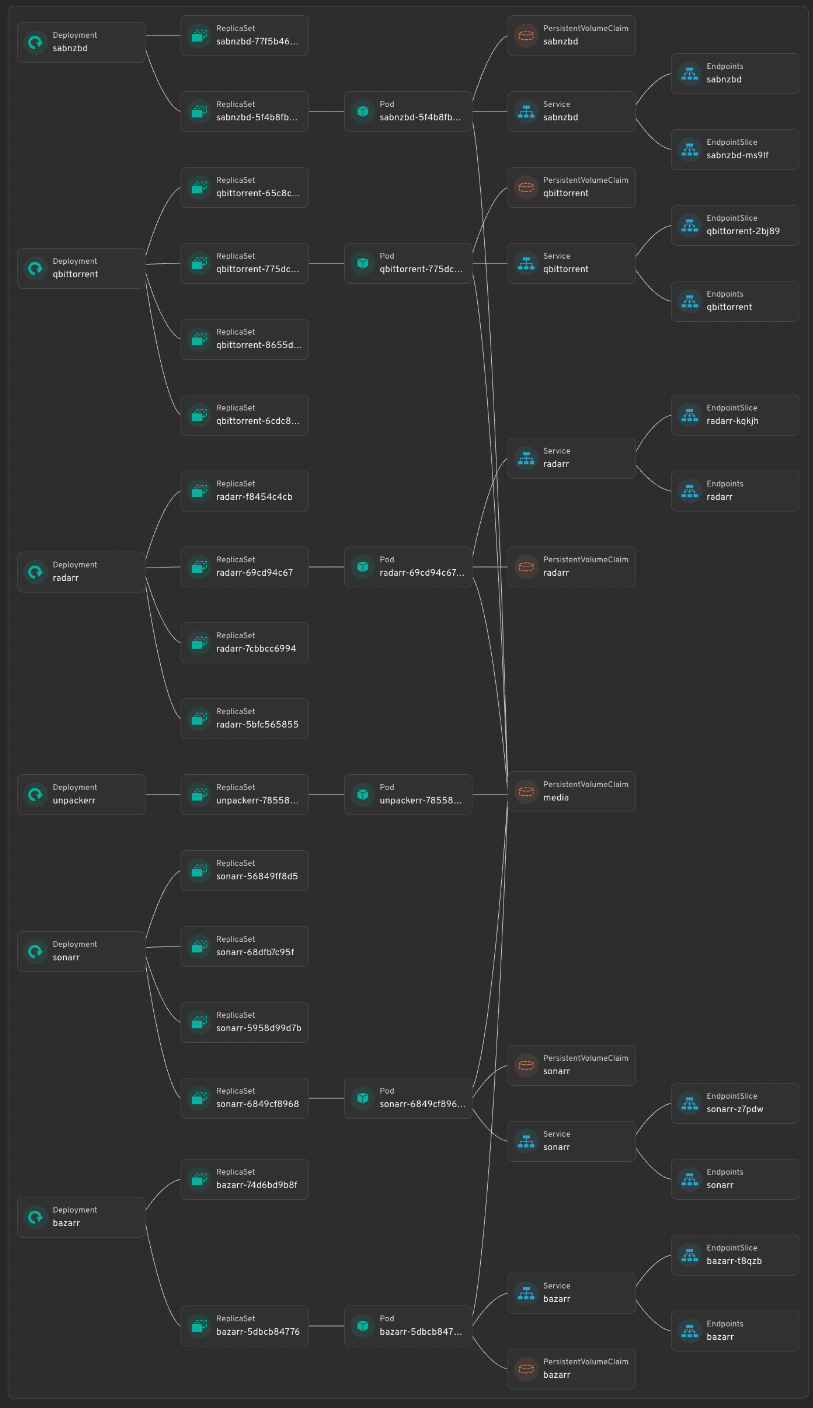
That map is Headlamp — a cluster UI I run in the cluster, with the Flux plugin — rendering the media namespace as a live dependency graph: every Deployment down through its ReplicaSets, Pods, Services, Endpoints, and the PVCs underneath. It’s the single most useful “what is actually running, and what’s wired to what” view I have, and the whole thing is clickable — tap any node to jump straight to its YAML, logs, or events. The stale ReplicaSets hanging off each Deployment are just rollout history; the live Pod is the one with a Service and Endpoints attached.
qBittorrent behind a VPN, and the auth saga
qBittorrent has to route through a VPN, which on Kubernetes means a shared-network-namespace pod: gluetun (Proton WireGuard, NL exit, kill-switch, NET_ADMIN + a /dev/net/tun hostPath) and qBittorrent in the same pod sharing one network stack, so all torrent traffic exits through the tunnel or not at all. A tiny sidecar syncs gluetun’s forwarded port into qBittorrent’s listen port via the localhost API. 2,708 torrents migrated. That part went fine.
Then the *arr couldn’t talk to qBittorrent, and untangling why was its own small epic:
WebUI\HostHeaderValidationdefaults on and rejects requests that arrive by Kubernetes service name. Has to be turned off.- Setting the WebUI password via API is a silent no-op in qBittorrent 5.2.2 —
setPreferencesaccepts it and changes nothing; injecting a PBKDF2 hash didn’t validate either. Only the browser UI actually sets it. - The fix that worked: enable qBittorrent’s auth-subnet whitelist for the pod CIDR (
10.244.0.0/16) so in-cluster clients bypass auth entirely — which, combined with host-header validation off, lets the*arrconnect by service name with no password dance. - Bonus: qBittorrent bans an IP after repeated auth failures, so while fighting the above I kept locking out my own debugging. And the
*arr“test” button uses the literal masked********value on save and fails;?forceSave=truesaves without the test. (Every time a UI hands me back a masked********I think of poor AzureDiamond confidently typinghunter2and wondering why everyone else just saw stars. Here the field genuinely sends the literal asterisks — the inverse failure mode, and somehow more annoying.)
SABnzbd had a quieter cousin of the same disease: its host_whitelist (in sabnzbd.ini, which lives in the PVC, not Git) has to include the service name or the dashboard’s API widget gets a 403 — even though the port is perfectly reachable. Which is the perfect segue.
Observability — the pillar Part 0 promised
Part 0’s roadmap listed an observability stack, and this is it: VictoriaMetrics + VictoriaLogs + Grafana + Alloy, plus an snmp-exporter scraping the Synology NAS.
Here’s a confession: I’d only ever run Prometheus. I’d been hearing for a while that VictoriaMetrics was the better choice, and this build was the excuse to finally try it instead of reflexively reaching for the thing I already knew. I’m very glad I did. The reasons it won me over, roughly in the order they actually mattered here:
- Memory, by a wide margin. For the same active series and retention, VictoriaMetrics runs in a fraction of the RAM Prometheus wants. When your “cluster” is two mini-PCs already running a media stack and a pile of databases, that’s the difference between monitoring being free and monitoring being a tenant that fights everything else for memory.
- Disk and retention. Better on-disk compression means more history for less space — I keep months of metrics without thinking about it.
- Long-term storage with no bolt-ons. Vanilla Prometheus is really a short-retention TSDB; keeping a long history usually means bolting on remote-write plus Thanos or Cortex plus an object store. VictoriaMetrics does long retention in the single component I already deployed. Fewer moving parts to GitOps and babysit is the whole reason I’m doing any of this.
- My Prometheus knowledge carried over wholesale. MetricsQL is a superset of PromQL, so every query, recording rule, and Grafana panel I knew kept working. I got the upside without relearning a query language — the best kind of migration.
- It speaks everything I already had. It scrapes Prometheus-style targets and accepts
remote_write, so the snmp-exporter and the Alloy collector plugged straight in with no translation layer. - One family for logs, too. VictoriaLogs is the logs counterpart, so metrics and logs come from the same lineage with the same lightweight resource profile — instead of pairing Prometheus with Loki from a different project and a different ops model.
- A scale-out path if I ever want it. If two nodes ever becomes more, there’s a clustered version with the same query language and no migration. I don’t need it today; I like knowing it’s there.
Alloy collects, VictoriaLogs holds logs, Grafana (on its own LB IP) renders it, and the NAS shows up over SNMP so storage health sits in the same pane as everything else. Metrics, logs, and a dashboard — all in-cluster, all GitOps-managed, and noticeably lighter than the Prometheus-plus-long-term-storage stack I’d have reflexively built a year ago.
The dashboard, and a validation lesson
Everything fronts onto a single Homepage dashboard, migrated into the cluster (Tailscale Ingress, LB IP) with its config shipped as a Kustomize ConfigMap.
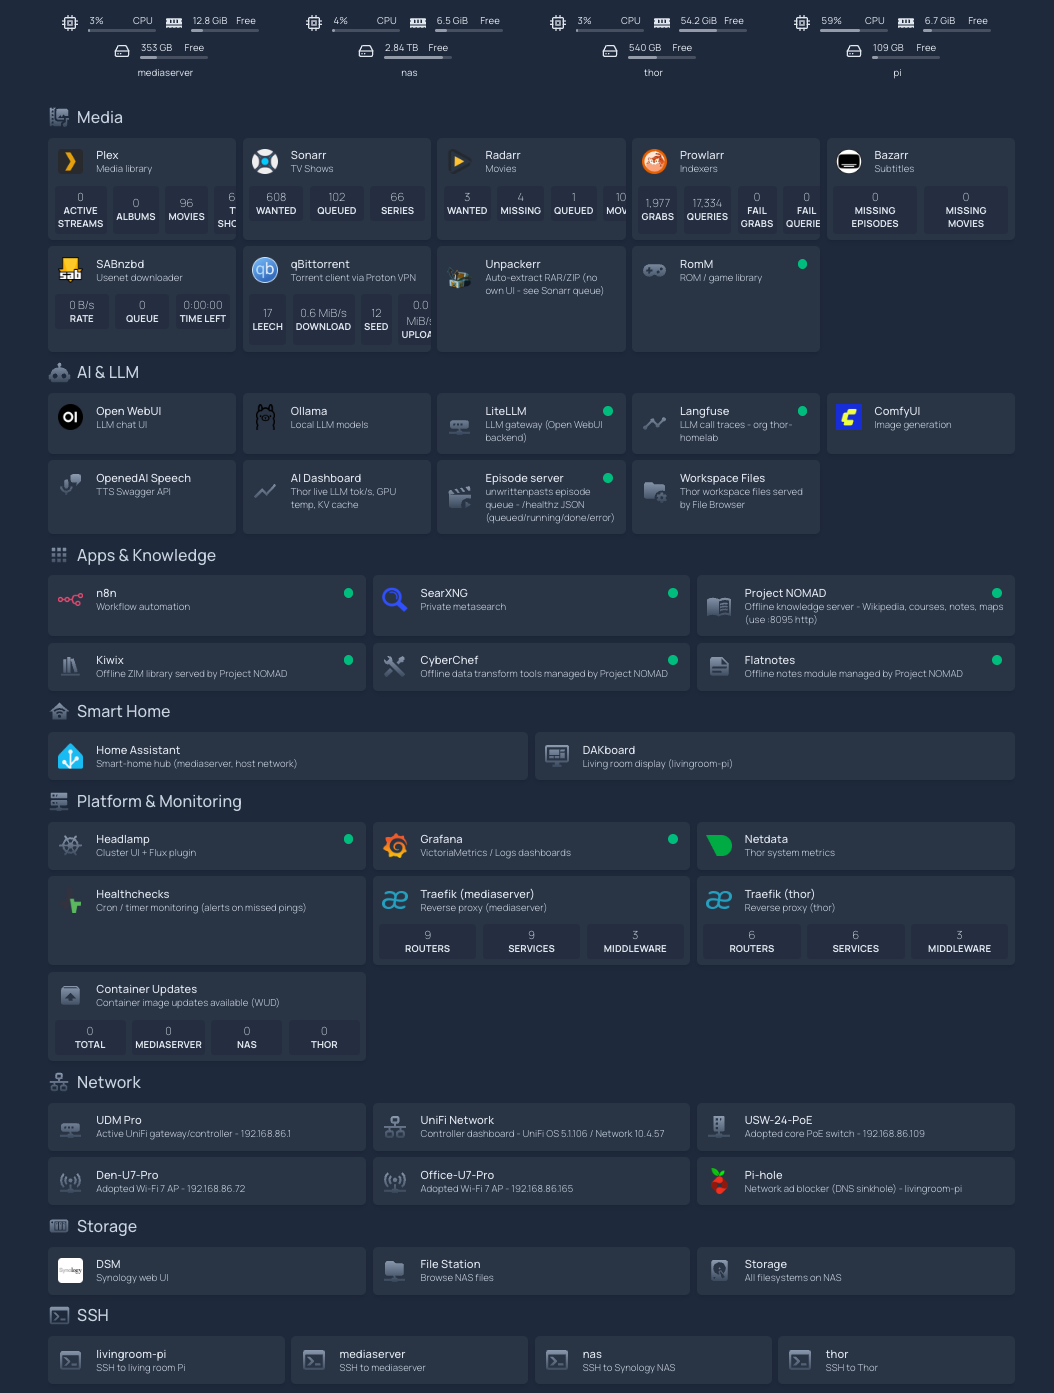
It’s the entire home lab on one page, grouped by function, and every tile is live. The status dot is a real health check against the service, the inline stats — download queue depth, disk free, what’s transcoding — come from each app’s own API, and clicking a tile drops you straight onto the service itself. It’s the front door to everything. The rest of this section is what it took to make that front door tell the truth, because a dashboard that’s green when things are broken is worse than no dashboard. Three traps worth saving:
- Read-only
/app/configcrashes on resync. Homepage re-runs its required-config init on every ConfigMap reload and tries to copy a missing skeleton file; on a read-only mount that’s anEROFScrash loop. Fix: provide every required file (including an unusedproxmox.yaml) and layer a smallemptyDirat/app/config/logs. - Use
tcpSocketprobes, nothttpGet. AnhttpGetprobe hits the pod IP, whoseHostheader fails Homepage’s allowed-hosts validation and returns 403 — so the kubelet kills a perfectly healthy pod. A TCP probe just checks the port’s open. - Config doesn’t hot-reload, and a stable ConfigMap name won’t roll the pod. I added Stakater Reloader and annotated the deployment
reloader.stakater.com/auto: "true", so a config edit rolls the pod on the next Flux apply.
There’s also a link convention that falls straight out of the Tailscale trap above: a dashboard tile’s href is browser-side, so it can be a .ts.net name; its widget/siteMonitor URL is fetched by the pod, which has no Tailscale, so it must use in-cluster DNS or a LAN IP. Same service, two different addresses depending on who’s doing the dialing.
And the lesson the SABnzbd 403 hammered home: a port-reachability sweep does not prove a widget works. I had a script that wget’d every endpoint and called green on a 200/301. SABnzbd answered 200 and its dashboard widget was still red, because the widget makes an authenticated, host-validated API call the sweep never made. Authenticated checks have to be tested with the auth. “The port answers” and “the feature works” are different claims, and only one of them is the one you care about.
Where it landed
$ flux get kustomizations
NAME              READY   STATUS
flux-system       True    Applied revision: main@...
controllers       True    Applied revision: main@...
config            True    Applied revision: main@...
apps              True    Applied revision: main@...
Twenty-one HelmReleases, all READY. Every pod Running. Every LoadBalancer holding an IP from the .235–.254 pool. The media stack, the download clients, RomM (a retro-game library, migrated the same week), SearXNG, n8n, Headlamp, and the observability stack all running on two mini-PCs, declaratively, with the dashboard reporting 24/24 endpoints reachable, zero red.
What didn’t move is as deliberate as what did. A handful of services are staying on their hosts, by design, because they’re coupled to something the cluster can’t give them:
| Service | Stays on | Because |
|---|---|---|
| Plex | mediaserver | Native install + hardware transcode |
| Home Assistant | mediaserver | NetworkMode=host + D-Bus for mDNS/Matter/Bluetooth discovery |
| Project NOMAD | mediaserver | Launches its own modules via the Docker socket; Talos has no Docker |
| The whole AI stack | Thor | GPU/Tailscale-coupled; consumed as an external endpoint (a tainted AI node is a maybe, see below) |
That table matters more to me than the list of things I moved. I never wanted “everything in Kubernetes” — I wanted everything that’s genuinely better off in Kubernetes there, and a real reason for each thing that stayed put. Plex needs the GPU and a native install. Home Assistant needs host networking and D-Bus to discover devices. NOMAD launches its own containers off the Docker socket, which Talos doesn’t have. Those aren’t holdouts I’ll get to eventually — they’re sitting exactly where they should. Figuring out what not to migrate was most of the actual work.
What’s next
- DNS HA. The one piece of the platform that’s still a single point of failure is DNS — Pi-hole on the living-room Pi. The plan: a second resolver in-cluster behind a LoadBalancer VIP, with UniFi DHCP handing out two DNS servers so either can die.
- Real etcd HA. Still two nodes. A third makes the control-plane VIP from Part 0 do its actual job — true three-node quorum instead of a VIP fronting a single point of failure.
- The Jetson, as an endpoint — probably. Talos has no Tegra support, so Thor can’t join as a normal node, and the clean answer is to leave it separate and let the cluster consume its inference as an external Service — two platforms meeting at an API. I’m still a little tempted to bring it in as a tainted, GPU-only worker running stock k8s instead, so the scheduler owns placement; undecided, but leaning toward leaving it be. I’d rather keep the cluster immutable than bolt on a snowflake to save myself one bit of wiring.
The cluster from Part 0 worked. The thing in Part 1 is a platform — it runs the house. The interesting question now isn’t “can I build it,” it’s “can I make it boring,” and boring is what Part 2 is about.